


Amazon Web Services or Google Cloud costs can be often somewhat confusing and it’s hard to “cut through the noise” to see what really matters. This article explains how to detect trends in cost or usage using Mann-Kendall analysis.
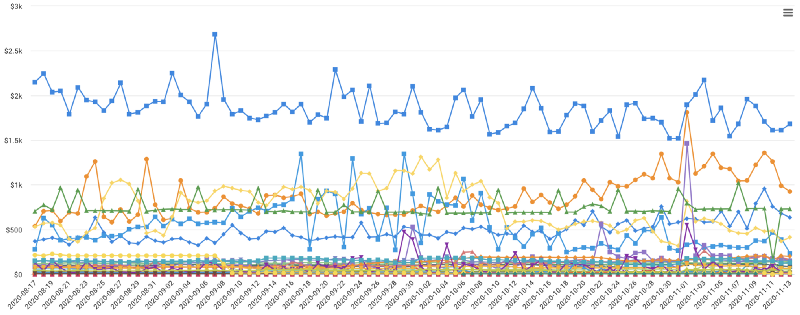
Imagine you are viewing overlapping time series data which breaks down your cloud spend by service over the past month (see below). When there are too many (in our example, 50) series of data, it becomes difficult to tell which series are trending up or down with the naked eye — after all, this usually is what we are interested in.
In this post, you’re going to see how to “separate the signal from the noise” when dealing with a lot of time-series data.
There are several approaches for checking whether or not there is a linear monotonic trend in a given time-series.
Detecting Trends with the Mann-Kendall Test
At DoiT International, as part of the Cloud Management technologies we build for our customers, we used the Mann-Kendall Test to create one-click Trend Analysis functionality [view video]. This is similar to a parametric linear regression analysis, which can be used to test whether the slope of the estimated linear regression line is different from zero. This regression analysis requires that the residuals from the fitted regression line be normally distributed; an assumption not required by the MK test (MK test is a non-parametric test).
Assumptions underlying the Mann-Kendall test
The test involves the following assumptions, given time-series data:
1. In the absence of a trend, the measurements obtained over time are independent and identically distributed.
2. The measurements represent the true states of the observables at the times of measurements.
3. The methods used for sample collection, instrumental measurements and data handling are unbiased.
Limitations to keep in mind
The Mann-Kendall test is not suited for data with periodicities (i.e., seasonal effects). In order for the test to be effective, it is recommended that all known periodic effects be removed from the data in a preprocessing step before computing the Mann-Kendall test.
Decomposition of time series
We can use the seasonal decomposition of time series by Loess (STL) to break a time series into seasonal, trend, and irregular components. This decomposition can be performed easily by using the Go
The method stl.Decompose takes as inputs the following required parameters:
- Time series you want to decompose
- Data periodicity
- Seasonal width
- Model type
The model can be either stl.Additive()when the variations around the trend do not vary with the level of the time series, or stl.Multiplicative() if the trend is proportional to the level of the time series.
You can decompose your time series and access each component in the following way:
res := stl.Decompose(timeSeries, periodicity, width, modelType)
trend := res.Trend
seasonal := res.Seasonal
residual := res.Resid
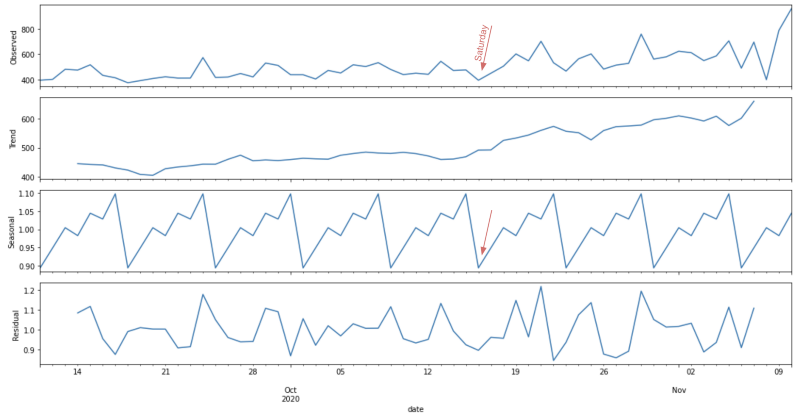
Below you can see an example of a decomposed time series with weekly seasonality using the multiplicative model. We can see that the values are trending up and observe seasonal ‘drops’ every seven days.
Performing your own trend analysis
Run the script below to view an example of how the Mann-Kendall test identifies a monotonic trend in a sample time-series.
If there is a trend present in your time-series data, you might want to compute the slope of the regression line. This will help you see how quickly your data changes. This information is useful when you want to, for example, filter out all time series whose regression slope is smaller/greater than X degrees.
Check how we implement trend analysis in action at DoIT International in our Cloud Management Platform here!