


A long path to making rate() to walk its talk
Recently I gave two-part series of talks on the Prometheus monitoring system. In the last chapter of the second talk, I touched on a rather convoluted topic where you can have your metric changes shoved under a carpet. This blog is a followup to the above talk series to elaborate on what may look like a controversy.

Initialize your (error) counters
When possible, initialize your counters with 0, so the metric will start to be reported immediately with, again, 0 as a value. Here is why:
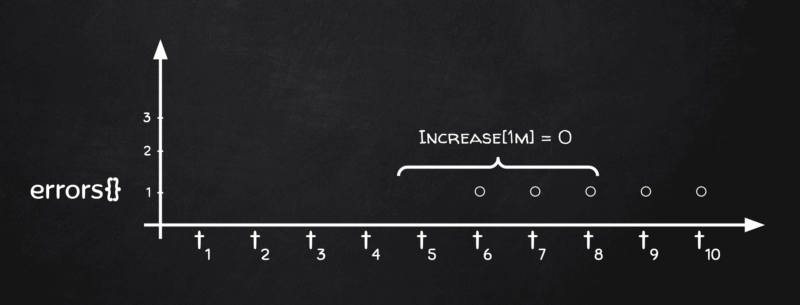
Above we have a metric that wasn’t initialized to zero. Now when the first error makes it to report “1” from now on, Prometheus (let’s refer to it just “P8s” for brevity from now on) will happily store it. But from its point of view, there was no change in the metric. Hence if you have an alert watching changes on that counter, it will surely miss the first error and someone with the pager can get a very sad smiley face soon.
The above may be surprising for a P8s newcomer but is well easy to grasp. And it is actually the only problem highlighted in this post that I’d leave to the app developer to tackle with.
Let’s move into advanced subtleties.
rate() does not show any changes
I often had a slowly increasing counter, possibly error counter, where running rate() returned all zeros despite my range being set by the book. Well, maybe my counter is not increasing indeed, I thought to myself as a self-soothing exercise, but that wasn’t the case:
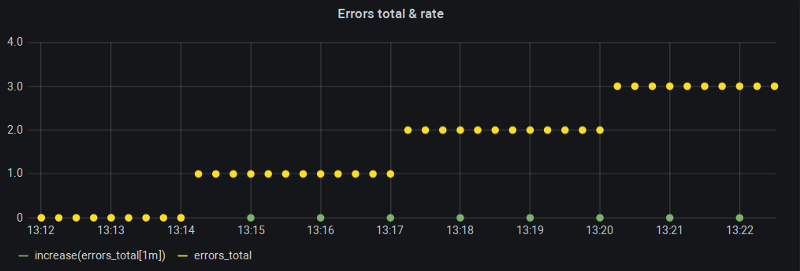
My Grafana “Min step” (and hence $__interval) was clamped to one minute and with 15s scrape interval that’s exactly the recommended look-back window for rate() function. So what is wrong here?
To understand that we need to turn back to the chalkboard:
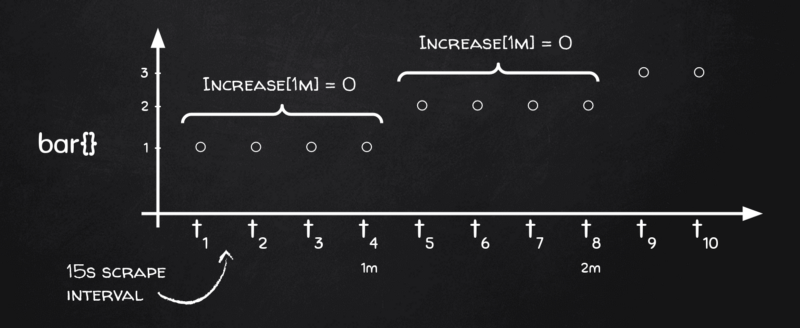
You see, depending on how stars align if our 1-minute range buckets land just on metric change boundaries, there is no change in the metric within that bucket at all and this is exactly why rate(), together with its sister increase(), returns zeroes.
Why does it reproduce so often and so consistently? Two factors:
- If you have a thing in your code that reports change around a whole minute(s) (think cronjobs), then it’s likely that the change will be attributed to the whole-minute boundary when scraping.
- As of two years ago, Grafana makes sure (and rightfully so) to align the start of the chart range to be a multiple of step, hence if your step in Grafana is one minute, the bucket boundaries will always fall on a whole-minute boundary, e.g. [ [18:06:00, 18:07:00], [18:07:00, 18:08:00], …].
Coupled together, the above creates a perfect storm (or rather perfect calm?) condition where rates turn to be all zero for counters that change their value on a whole minute boundary.
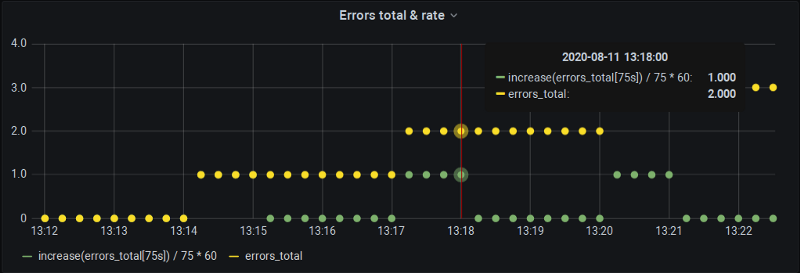
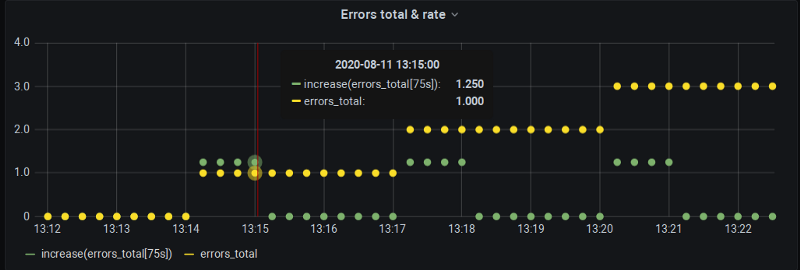
But don’t take my word on it — let’s change the step from 1 minute to 15 seconds and see what happens (basically calculating rate() at every scrape over the last 4 samples).
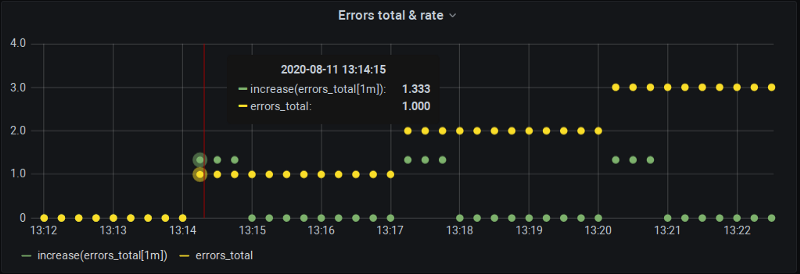
Aha! Two interesting things we can observe here:
- Indeed the chalkboard drawing stands true — our metric changes at 13:14:15, but
increase()at 13:15:00 is zero since, again, we got “perfect” bucket alignment here where changes all fall on the boundaries. - At 13:14:15
increase()does report a change but… it’s bigger than the actual one! Namely, 1.33 instead of 1.0.
Why? Back to chalkboard again:
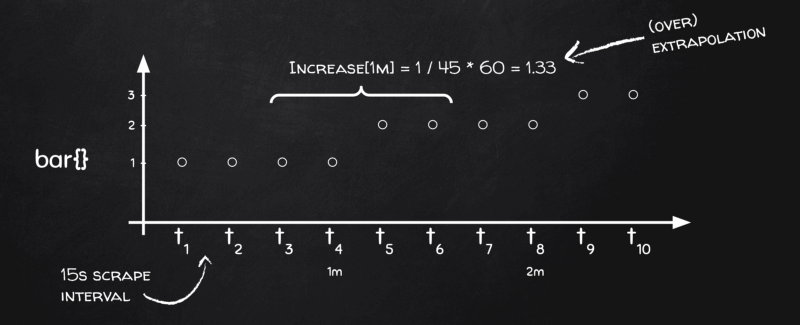
You see, we have four data points in each bucket, but we need delta over time, remember, and time-wise our four data points only cover 45 seconds instead of 60! — 15s for [t₃, t₄], another 15s for [t₄, t₅] and the final 15s for [t₅,t₆]. The next bucket will be [t₇, t₈], [t₈, t₉], and [t₉, t₁₀], but no bucket will contain interval [t₆, t₇]! And that’s because Prometheus applies the same bucketing algorithm both for first-order calculations (e.g. averages on gauges) and second-order calculations (e.g. rates on counters).
So basically Prometheus understands that the actual range in each bucket is one scrape less, i.e. 45 seconds instead of 60 in our case, so when it sees metric changed by 1 in a bucket, it’s actually “by 1 in 45 seconds”, not “by 1 in 60 seconds”, so it extrapolates the result as 1 / 45 * 60 = 1.33 and this is how we end up with increase() values being larger than the actual change.
At this point, if you are still not convinced that Prometheus is good for monitoring but not suitable for the exact data like billing, I’d rather not to do banking with you :)
Now if only we could tell Prometheus to include that extra scrape that falls between the c̶h̶a̶i̶r̶s̶ buckets…
The long way to peace
How do we fix it if at all?
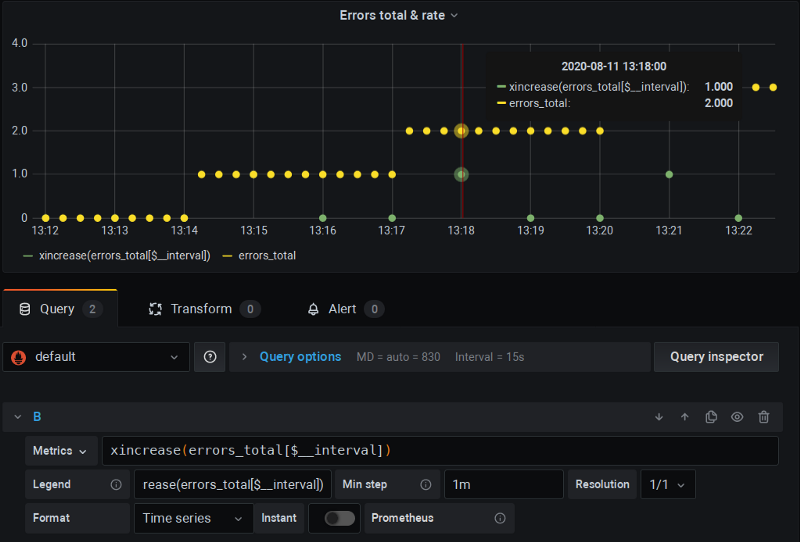
For starters, we can control our range and step ourselves:
To get the increase over 60 seconds, we ask P8s to calculate one for 75 seconds (with that extra sample that usually falls between the buckets). Of course, Prometheus will extrapolate it to 75 seconds but we de-extrapolate it manually back to 60 and now our charts are both precise and provide us with the data one whole-minute boundaries as well.
The downside of course if that we can’t use Grafana’s automatic step and $__interval mechanisms. But at least we are covered for alert definitions in Grafana where intervals are imputed manually anyhow.
What next?
Nothing too official yet, unfortunately. There is ongoing work in Grafana to introduce $__rate_interval. Using this variable instead of plain $__interval will indeed include that extra scrape behind the step to make sure we do get data on, e.g, whole-minute points as per our demonstration. However, it will still leave interpolation intact:
There is some traction on this issue lately so hopefully, it will be available in the next Grafana release to make zero rate() values go away.
If we want to fix extrapolation “correction” there are two options that I know of.
xrate
This is a fork of Prometheus that adds rate(), increase(), etc. functions that both add extra scrape (similar to as $__rate_interval will do) but will also apply de-extrapolation as we did in the last chapter example:
Here you can see I’m running this forked P8s version and using standard $__interval and “Min step” clamping; and everything just works — there are no all-zeros and calculations are correct.
While this is a fork, it follows closely the official Prometheus releases and
Alin Sinpalean (the maintainer) has been keeping it afloat for the last couple of years. I didn’t use it in production, but I’ll definitely give it a shot in my next project.
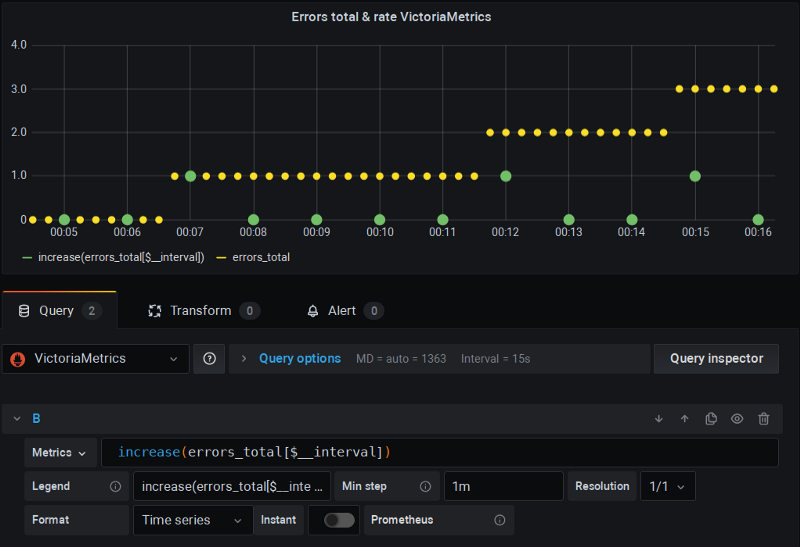
VictoriaMetrics
This is a remote-storage* project for Prometheus that in turn implements “fixed” version of rate functions that both accommodate extra scrape and no interpolation.
* I.e. you configure, potentially multiple instances of Prometheus to send data to VictoriaMetrics and then run your PromQL against the latter.
Again, I’m using Grafana as usual and things just work:
Epilogue
I hope this post helps you to make sense of your Grafana charts and make peace with how things work here. I, personally, would give a serious go to both xrate fork and VictoriaMetrics the next time I deploy a monitoring system.
If you are interested in details of why does this issue exist at all here are rather long discussions on the subject:
- An excellent blog that explains these kinds of problems and their evolution: link
- My original “What a…?” post in P8s users group: link
- rate()/increase() extrapolation considered harmful: link
- Proposal for improving rate/increase: link
For the closure let me add that this issue divides people into camps of “P8s core developers vs the rest”; and while P8s developers may have their own reasons to say they are right on this one, the problem does happen in real life and quite often. By ignoring this fact they only cause, citing Alin Sinpalean here, “making everyone except Prometheus acutely aware of the difference between a counter and a gauge: “you must use $__interval with gauges and $__fancy_interval with counters, good luck" ”.
I am taking sides here... Let the forks speak. Peace on your data.