


BigQuery is one of the most performant data cloud data warehouse for analytics. Grafana is an open platform for beautiful analytics and monitoring. Wouldn't it be the only natural to combine the power of both? We thought it would!
It’s hard to imagine any company not using Grafana to visualize their time series data. It may be for monitoring, alerting, analysis or all of those reasons. Grafana supports many popular time series data sources such as InfluxDB, Graphite, Elasticsearch and many others.
Google BigQuery is a popular cloud database when it comes to data analytics due to its unparalleled capability to execute queries very fast over very large data sets.
Fortunately, Grafana provides a documented interface on how to build new data source plugins. My colleague Aviv Laufer from DoiT International’s solutions team was able to build the data source plugin for Google BigQuery.
The applications are nearly endless, — dashboards analyzing logs, billing data, sales metrics, traffic analysis, tracking digital marketing campaigns or any other use-case.
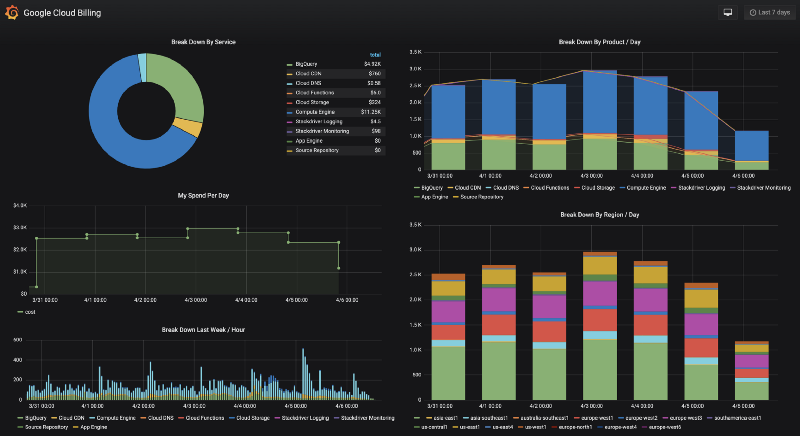
To demonstrate the new data source plugin, I have opted to Google Cloud billing data which can resonate to anyone who uses Google Cloud. In short, you can configure your Google Cloud to export detailed billing information to BigQuery [1]. Exporting your billing data to BigQuery allows you to easily track the cost of your Google Cloud services in a very detailed day.
Since the BigQuery data source plugin is not yet an “officially” supported plugin by Grafana, you will need to install it manually from the plugin’s git repository [2].
In most cases, the installation is a single command on your Grafana server and then restarting Grafana. The complete instructions are reflected in the installation section of the repository at [3].
grafana-cli \
--pluginUrl \
https://github.com/doitintl/bigquery-grafana/archive/0.3.0.zip
\ plugins install doitintl-bigquery-datasource
Once the plugin is installed, you’re ready to use it. The plugin needs to be authenticated with your Google Cloud IAM by setting up a service account and uploading the service account’s JSON key.
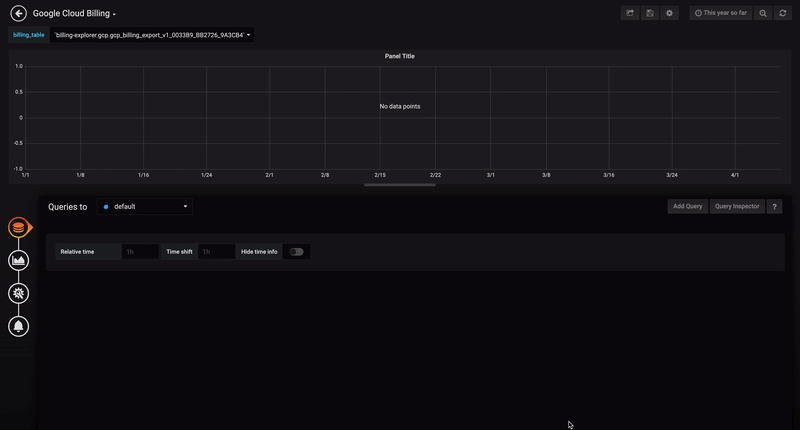
After the authentication, you’re ready to create your first dashboard. The plugin allows you to build the underlying query visually by simply following the wizard.
Start with selecting your Google Cloud project from the list, select your dataset and table names. The plugin will fetch the columns of your table (along with metadata to reveal whether your table has partitions etc.) so you can pick them from the drop-down lists.
Then, select the field/s you’d like to visualize, including the required aggregations and voila, — your data will appear momentarily!
If you prefer to write the query yourself, you can do that by clicking the “Edit SQL” button
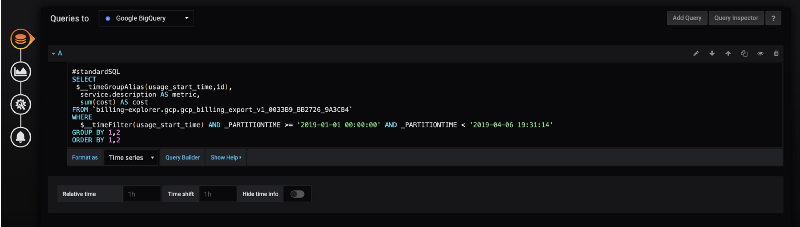
Notice how the plugin was able to determinate this is the partitioned table and automatically include the _PARTITIONTIME filter so you will only scan the data in your time range!
We hope you’ll find the BigQuery plugin for Grafana just as useful as we do and we would love to hear about your use-case! While these are still the early days for this plugin, we are tracking the issues very closely and promise to address every one of your requests promptly [4].
Happy charting!
Want more stories? Check our blog, or follow Vadim on Twitter.