


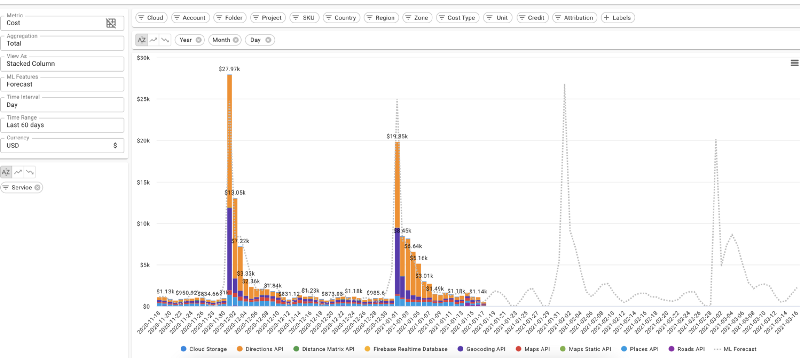
My team and I recently built a cloud-spend control system that helps users more-easily analyze their cloud costs. But we also wanted to go further and give users a glimpse into the future with one-click forecasts. To accomplish this, we based our solution on very capable forecasting tools, including Facebook’s Prophet, and thought that it would be helpful to share our insights!
Tip #1: Know your Prophet
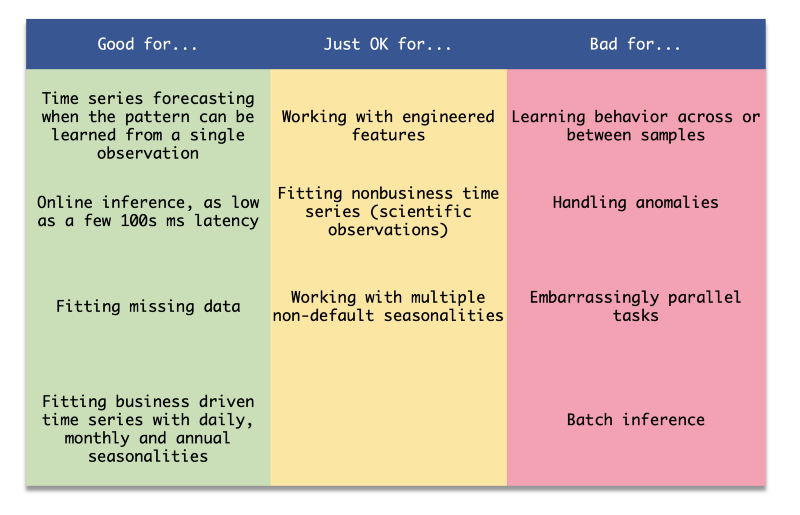
Prophet is a great library for certain problems but it can easily underperform other tools in certain tasks. What is it good for? The Prophet is very good for generating forecasts for a series using the series data itself. It’s less good when you want to add more features or learn from similar series (for example: when you have multiple accounts that share a similar behavior).
The way to work with Prophet is different than how you would usually work with services based on neural networks. Instead of maintaining a serialized trained model and invoking predictions in real-time, you actually train and predict the model per call. For this reason, it takes multiple CPU cores (around 8 cores should be fine) to handle a single request.
An additional feature of the library is its design to fit business-related trends (like daily and monthly seasonalities), out of the box Prophet may perform not so well on other types of time series (like radio signals). If you encounter a problem that Prophet is not optimized for you my want to consider NeuralProphet, DeepAR, ARIMA, or other algorithms, libraries and cloud tools specialized in time series forecasting.
Tip #2: Create Prophet Sub-Classes
Out of the box, Prophet can generate incredibly accurate forecasts. But there is no free lunch, even in this case. Some trends have a stronger seasonality component than others while others tend to be smoother with fewer change-points, etc. While Prophet supports the same long list of frequencies as pandas’ time offsets, your app may not necessarily have to support all of them.
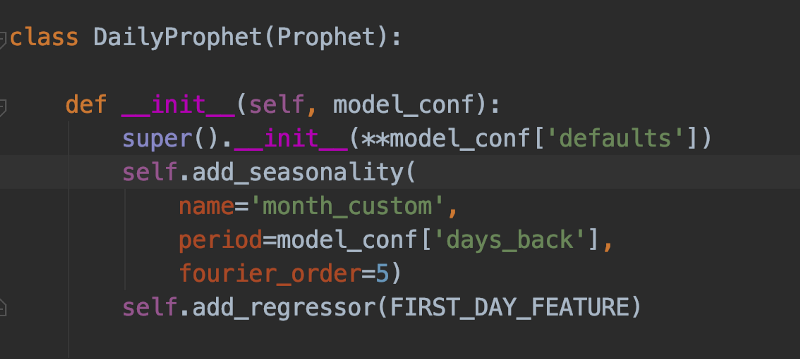
Perhaps, instead, you would only wish to support a small and finite set of frequencies such as Daily, Weekly, and Monthly. In this case, you may find it useful to create a subclass of Prophet-per-frequency and set it differently for each class:
In order to find the optimal parameters per class, you can build a dataset and run a hyperparameter tuning job on it. See if you can find a set of parameters that outperform others in objective metrics like mean-squared-error or mean-absolute-percentage-error.
In our case, the daily data contained recurring monthly billings (like your support bill) that show up on the first day of each month. Additionally, we noticed that the data tends to be a correlative month over month due to some underlying discount regimes that Google Cloud and AWS apply. We improved our predictions’ accuracy by creating a special Daily-Prophet object, adding a custom regressor for the beginning of the 1st of every month, and setting it up with a custom seasonality of 30.5 days. We also initialized the super() method of this object with custom hyperparameters that we optimized for daily predictions.
Tip #3: Give the Prophet enough CPU and RAM
Prophet’s service can be easily containerized and served on tools like Google Cloud’s Cloud Run. However, this library, based on pystan, can be very resource-hungry. We found that the optimal solution in terms of ease-of-management and performance was to deploy the service onto Cloud Run over Anthos (GKE).
This way we were able to provide the service with strong, compute-optimized machines that reduced prediction time by 60% compared to native Cloud Run. Since the service utilized all the cores and the RAM we gave it, we also restricted each Cloud Run instance to handle only a handful number of requests in parallel, leveraging Cloud Run and GKE’s capability to scale up and down quickly!

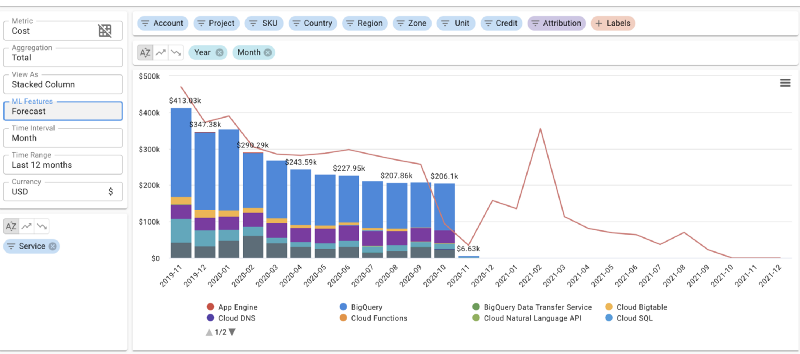
Tip #4: Don’t forget to plot, embed more business knowledge
Sometimes viewing the trends that you get is more important than evaluating your results on a test-set. While you may optimize the mean-squared-error, sometimes this score will not reflect some business behavior that you failed to capture.
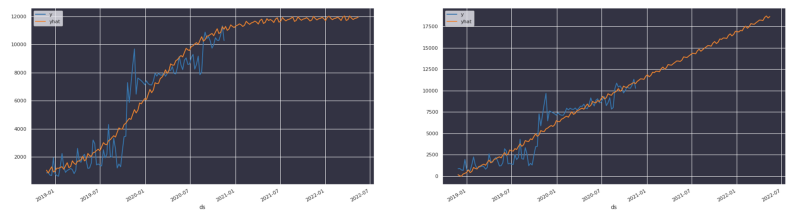
In our case, we learned that cloud spend doesn’t tend to grow linearly. Instead, it is better characterized as a logistic function with an asymptote (capacity limit) that is derived from financial considerations.
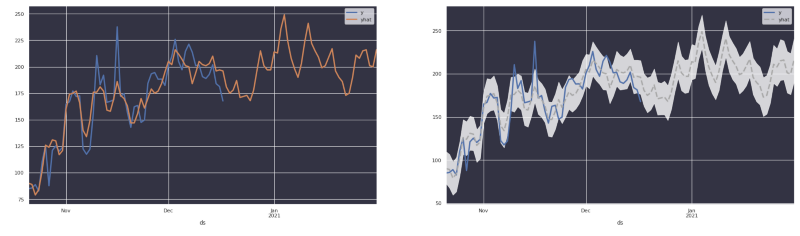
Tip #5: Not sure? Express your uncertainty!
We learned that users tend to expect that the prediction will have a low margin error— often, closer than what can be realistically expected from a time-series forecasting tool.
In the above images you can clearly see that when using Prophet, the library emits an estimation of the original trend and not necessarily the real numbers. Users then get really confused when presented with a forecast that looks similar to the original trend.
As a result, you may want to consider the following:
- Express the forecast as a dotted grey line.
- Add a confidence interval.
- Consider replacing “yhat” (predictions) with “y” (historical observations) when possible.
You can control the width of the intervals by providing it as a parameter to the constructor
Tip #6: Use Pre-processing and Post-processing
When sending data for predictions, we may forget that algorithms are not aware of the context in which the time series is generated.
In our case, we used to send aggregated, monthly cost data in order to generate monthly predictions. In the first weeks of each month, the last observation was significantly lower, making Prophet fit a sharp drop in the future trend. Removing data-points that we know to be corrupt can improve the results dramatically. Remember that Prophet can handle missing values well; so often it’s better to drop noise than fit it!
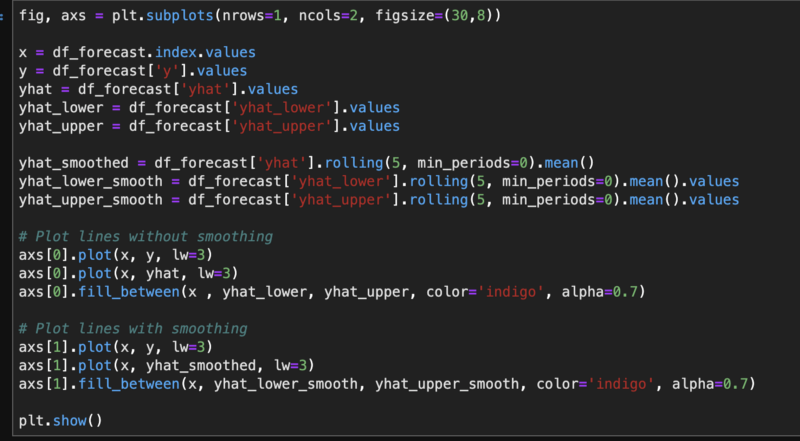
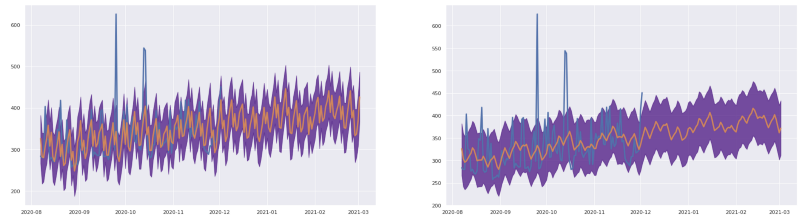
Other options of improvement by processing may include using Pandas’ rolling function to apply sliding-window filters on the results.
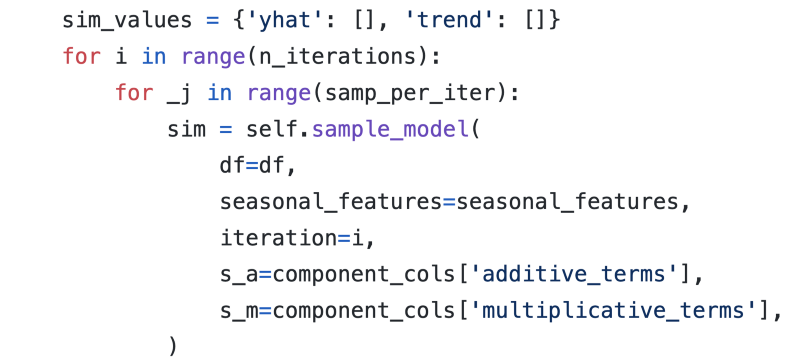
Tip #7: Speed up your inference by ignoring uncertainty
Prophet fits a probabilistic model to the data and then iteratively samples the distribution in order to estimate the noise (and the prediction intervals that are associated with it).
After performing some run-profiling on my service, I discovered that this sampling process is responsible for a fairly large portion of the overall program run-time. This iteration runs many times until it can generate enough samples to estimate the noise. If you are not interested in the prediction intervals, you can reduce set the uncertainty_samples parameter to a lower number (even 0) and significantly reduce the runtime of the program!
Of course, this tip goes against tip #5 that tells you how important it is to present the uncertainty. I guess that software development is always about tradeoffs, isn’t it? :)
That's all folks! If you have any comments, please feel free to leave them below!
Gad Benram is a Senior Research Engineer in the Office of the CTO at DoiT International. Want to work with Gad? Check out our careers page.